The nice thing about being delayed for 3 hours at the airport is that it gives you time to catch up on reading and to write blog posts. And the airline feeds you snacks. And you can share the snacks with the little bird who is flying around inside the terminal. My new sparrow friend, I call him Peanut, liked the crust of my PBJ and also seems to enjoy Cheetos (the crunchy ones, not the puffs).
So, before I give tiny Peanut (or not so tiny Me) diabetes, I think this is a good time to put away the little bag of cookies and discuss two things we can do to our variables prior to analysis, normalization and standardization.
Why would we do this to our data? Because sometimes we want to compare data measured in different units, to more accurately or easily see the differences. We normalize or standardize to take away the units of measure and just look at the magnitude of the measurements on one uniform scale. Normalization and standardization allow us to take apples and oranges and compare them like they are both the same fruit.
Mathematically, normalization and standardization are needed when measurements are being compared via Euclidean distance. I’ll let you research the math stuff on your own.
An example for using normalization or standardization would be comparing test scores on two different tests, say, an English test that has a range of scores from 50 to 250 and a math test that has a range of scores from 200 to 400. If we were to leave the scores as is and compare students’ scores on each test to see which test they performed better on, then of course almost everyone would do better at math.
And we know not everyone does better at math! So, we need to scale the scores in a way that will allow us to compare the scores on an even playing field.
Normalization
You will see the word normalization used for many different approaches to data transformation. In this post, I am describing the normalization technique of “feature scaling” which is used to make all of the raw data values fit into a range between 0 and 1.
And since statisticians have at least three names for everything, it is also called “min-max” normalization and “unity” normalization.
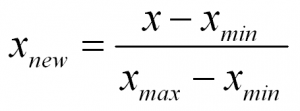
To normalize a variable to a range between 0 and 1 you need the lowest value and the highest value of the measurements on the variable and then use a simple formula to use on each measurement:

In words:
Normalized Measurement = (original measurement – minimum measurement value) divided by (maximum measurement value – minimum measurement value)
There numerous techniques for normalizing variables. A few are normalizing within a range of (-1 to 1), and mean normalization. And you might want to check out the coefficient of variation too.
Standardization
Standardization is a type of feature scaling and you may even hear it referred to as normalization. The formula below will transform your data so that the mean will be 0 and the standard deviation will be 1 (called a unit standard deviation).

In words:
Standardized Measurement = (original measurement – mean of the variable) divided by (standard deviation of the variable)
When to Normalize? When to Standardize?
In many cases you can use normalization or standardization to scale your variables. However, if you have many outliers, normalization will not show outliers as well, because all data is scaled between two numbers (0,1).
On the other hand, standardization does not have any constraint on the resulting range of numbers. So, although in a normal distribution we would like the range of numbers to be between -3 and 3, they don’t have to be…so you will see outliers (such as values of say, -5 or 3.4, etc.) more easily.
Also, standardization makes it easy to see if a particular measurement is above or below the mean because negative numbers will be below the mean of 0 and positive numbers will be above the mean of 0.
And retaining the spread using standardization allows one to assign probabilities to measurements, and percentiles, while taking into account the spread of the data
References:
https://www.statisticshowto.datasciencecentral.com/normalized/


